Datadog Launches GPU Monitoring Worldwide — Targets the 14% of Cloud Spend AI Workloads Now Eat (April 2026)
Datadog announced general availability of GPU Monitoring on April 22, 2026, framing the launch around CPO Yanbing Li's claim that GPU instances now account for 14% of compute costs. The product links GPU fleet health, cost, and AI workloads in a single view.
On , Datadog (NASDAQ: DDOG) announced the general availability of GPU Monitoring, a new product that links GPU fleet health, cost, and AI-workload performance into a single view — aimed squarely at companies struggling to keep AI infrastructure spend under control.
What Happened
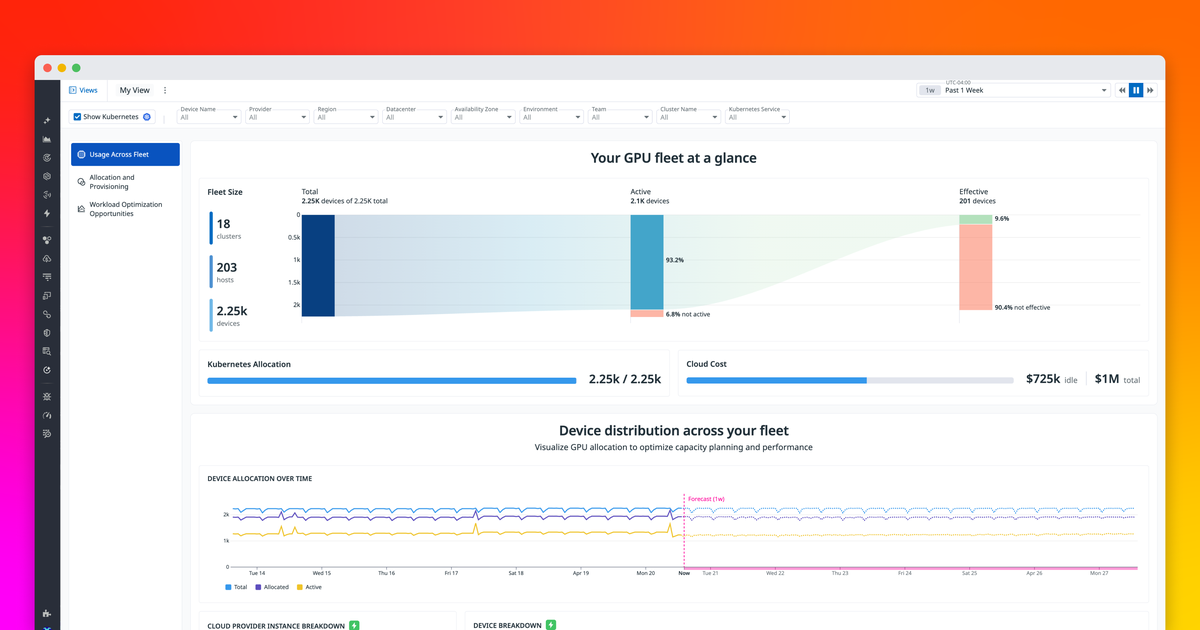
Datadog rolled out GPU Monitoring worldwide as part of its core observability platform, framing the launch around a single statistic: GPU instances now account for 14 percent of compute costs, according to Chief Product Officer Yanbing Li. The new product gives platform-engineering and machine-learning teams a shared view of every GPU in their fleet — per-instance and per-device — including core utilisation, memory, power, and thermal metrics out of the box.
According to the official press release, the launch “marks one of the first times a single solution provides unified visibility across the AI stack — giving customers a single view linking GPU fleet health, cost, and performance directly to the teams relying on them for faster troubleshooting of slow workloads and cost savings.”

Key Details
- 14% of compute spend — Datadog’s headline number for how much GPU instances now consume of total cloud bills, the same number Yanbing Li used to frame the launch.
- General availability worldwide — GPU Monitoring is shipping today in every Datadog region, no closed beta or staged rollout.
- Out-of-the-box per-device telemetry — core utilisation, memory, power, and thermals are collected per instance and per device with no extra setup required.
- Workload-to-GPU correlation — stalled training and inference jobs are linked directly to the underlying GPUs, pods, and processes, replacing what Datadog calls “hours” of triage work with “minutes.”
- Capacity forecasting — usage-pattern-based forecasts tell platform teams whether to buy new GPUs or free up existing ones before the next procurement cycle.
- LLM Observability integration — GPU Monitoring stitches into Datadog’s existing LLM Observability product so teams can pivot from a model-latency spike to the underlying GPU metric without switching tools.
- Customer launch partner — Hyperbolic, a multi-tenant GPU cloud, is quoted in the release saying isolated per-customer dashboards take “minutes” to stand up.
What Developers and Users Are Saying
On Hacker News and r/devops, the reaction is mixed. Engineers who already pay Datadog for APM and infrastructure metrics are broadly positive — one extra integration point is cheaper than buying a separate GPU-specific tool like NVIDIA DCGM or stitching together Prometheus exporters by hand. The dominant criticism is unsurprising: price. Datadog’s observability bills are already a meme on engineering Twitter (“the Datadog tax”), and adding per-GPU billing on top of per-host billing has commenters worried that the bill will scale linearly with their rented A100s and H100s.
Yanbing Li’s framing — that this is a “board-level conversation” — is also drawing eye-rolls from senior engineers who note that the actual problem (overprovisioning because nobody can see utilisation) was already solvable with open-source tools, just less conveniently. The counter-argument from launch customer Hyperbolic, on the other hand, is that getting per-instance utilisation, memory, power, and thermal data “right out of the box with no extra setup” is genuinely a step change for multi-tenant GPU operators.
What This Means for Developers
If you already run Datadog, GPU Monitoring is a low-friction add-on: the agent picks up NVIDIA telemetry automatically, dashboards work without configuration, and the alerting model is the same one you already use for CPU and memory. The practical action item is reviewing your existing pricing tier — GPU monitoring is bundled into the standard infrastructure plan, but heavy AI workloads can push you into a higher SKU faster than expected.
For platform teams running self-hosted observability (Prometheus + Grafana + DCGM), this launch raises the bar on what “good” looks like. Workload-to-GPU correlation, capacity forecasting, and per-team chargeback are exactly the gaps that home-grown stacks struggle with. Whether the savings on GPU spend justify Datadog’s pricing will, as always, depend on the size of your fleet.
What's Next
GPU Monitoring is generally available immediately. Datadog’s annual DASH 2026 conference — where it has historically launched its biggest AI features — is the next natural milestone for further expansion, particularly tighter integration with the company’s LLM Observability and AI Agent monitoring products. Datadog also reports its Q1 2026 earnings on May 7, which will likely include early customer adoption signals.
Sources
- Datadog press release on GlobeNewswire — primary source with full quotes from CPO Yanbing Li and Hyperbolic.
- Datadog Blog: Understand GPU usage, performance, and cost — technical deep-dive on the new product.
- Datadog Investor Relations announcement — same release filed with investors.
- StockTitan coverage — financial-press take on what the launch means for DDOG.
- Investing.com summary — cross-reference on positioning vs. AI-cost tooling.
Stay up to date with Doolpa
Subscribe to Newsletter →